Energy and sustainability solution
Turn consumption metrics into a clear picture. Display electricity, water and gas use, compare periods and share conservation messages across buildings, factories and branch networks.
Talk to our specialists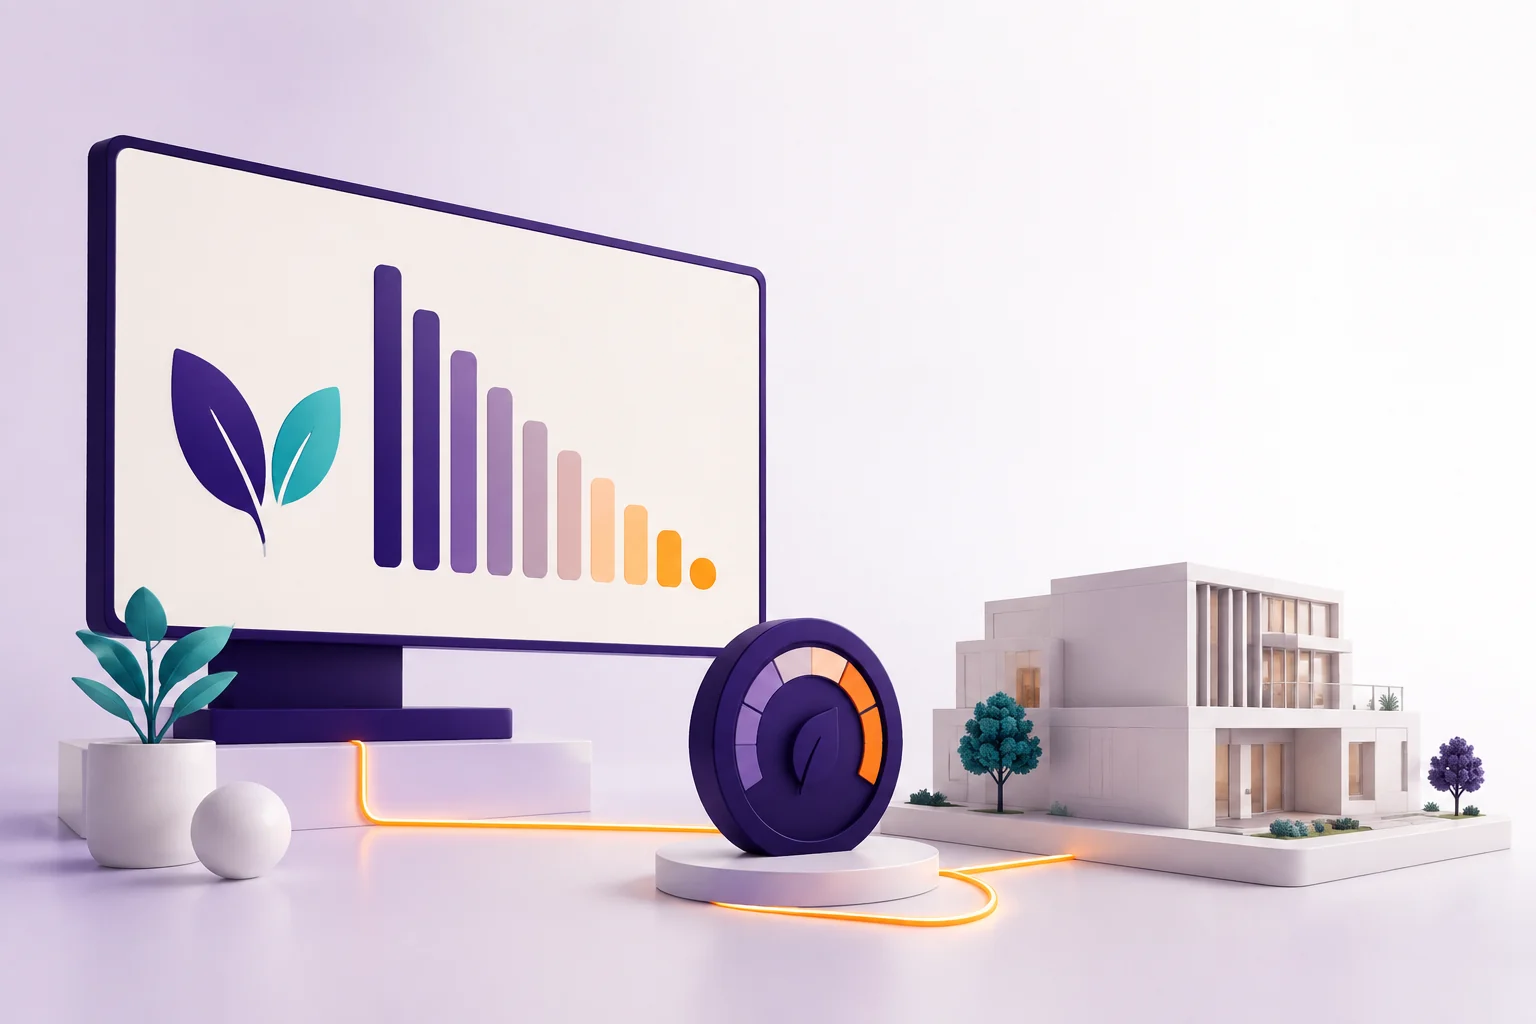
A display in an office building or a network of displays across factories can create a shared view of energy consumption. This solution brings together your organization’s approved data, consumption targets and educational messages.
Consumption data everyone can understand
A consumption figure is meaningful when its unit, comparison period and timestamp are clear. The SignagePlus energy scenario focuses on readable metrics and messages suited to each location, from employee boards to lobbies and public spaces.
Elements to consider when designing the solution
- Consumption metrics with units, reporting periods and update times
- Period comparisons and targets set by your organization
- Building, branch or department-specific content using authorized data
- Charts combined with educational messages and internal guidance
A practical scenario
The energy manager defines the approved metrics and the target for the period. The content owner selects the charts and employee messages. The display presents the current period alongside the target and data timestamp so the audience can compare figures correctly.
Designed around your data and needs
The project review defines data sources, units, refresh frequency and approval ownership. Connections to files, APIs, meters or building management systems are assessed for source access and compatibility. Any claim of reduced consumption also requires actual measurement on site.
Frequently asked questions
What information is needed to get started?
Specify the building type, required metrics, sample data and display location so we can assess the content mix and how to receive the information.
Does this solution control equipment consumption?
This solution covers metric display and communication. Equipment control is a separate requirement that must be assessed in the project specifications.
What happens if data is delayed?
The project design defines how to show the latest data timestamp and handle outdated information, so viewers can recognize its update status.
Design your organization’s energy scenario
Share your metrics and data sources so we can discuss a display format suited to your building or branch network.